 |
The Option Model for the New Millennium. |
| OPTION SERVICES for COMMODITIES, CORPORATION: | |
OSCC Summary of
CBOT Soybeans
Futures &Options.
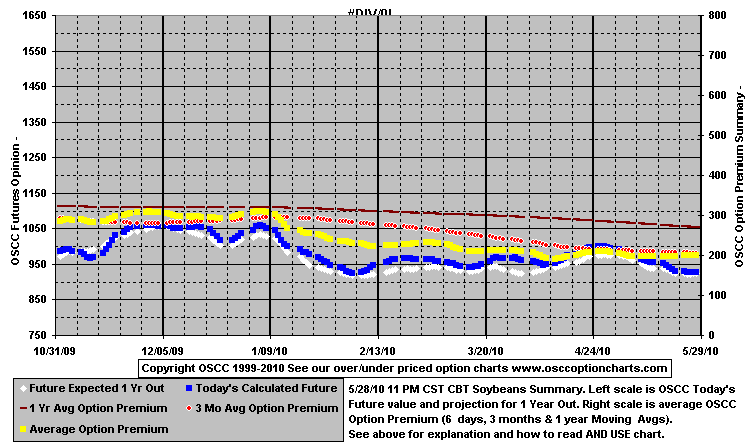
This chart shows the average of the OSCC Total Dollar Normalized Option Premium
and this number adjusted for the value of
these options. It also shows the OSCC opinion of the current future value
and a one year traders projected value
Comments
and analysis can be found in our
when appropriate..
How to read and use our charts.
Our charts show the daily average of the
"OSCC Relative Normalized
Total Dollar Option Premium" or "NTDOP"
values of current contracts, assuming there are enough strike prices with values
to make the calculation. The charts enables a trader to see our opinion of how
option premiums are changing. Option premiums change for two basic reasons. The
risk that the future is going to move up or down because of market factors (this
is market risk or "OSCC Real Risk") and the risk the trader takes for the amount of the
change in the value of the future itself. See the NASDAQ 100 futures and option
charts for a good example. A
trader would of course expect a futures contract of a $1,000,000 to have a
higher premium than one with a value of $100,000, market risk being the same. We
remove that part of the premium by "Normalizing" the future to a value
of $100,000 for one of our calculations. That is, we take out what we consider
future change premium. What's left is market or the OSCC Real Risk.
Because of the way it is done, the number can be larger or smaller than the
NTDOP. What is important is their relative spacing and pattern. If the
"normalized premium drops away from this line it lacks "future
value". Either premiums need to increase or the future needs to drop the
bring the "future adjusted value down. The reverse is also true if
the "normalized premium pushes up towards "adjusted value",
either it has to much premium or the future has to rise to compensate. The lower
the overall adjusted premium is means you are using less premium dollars for
every $100,000 dollars of futures you are leveraging. Brokers can help with strategies to take
advantage of these projected values. We, of course, are not responsible for any
decisions a trader may make using these charts. We are not writers so if
you have comments (good or bad), requests, questions, or need an explanation of
our charts Please contact us at:
Go to: Forums visited list and contact
information. We do not redistribute email
address.
Soybeans Return to option charts index page
Go to Soybeans Futures Chart
Go to Soybeans Combined Chart
Go to Soybeans Front Yr Expiration Option Premiums
Go to Soybeans Back Yr Expiration Option Premiums
Go to Over & Under Priced Call
Front Yr Options
Go to Over & Under Priced Call
Back Yr Options
Go to Over & Under Priced Put
Front Yr Options
Go to Over & Under Priced Put
Back Yr Options

Email This Option Website To A Friend
We have a new
"Chart explanation page" to help explain how our charts look over time.
This page includes an explanation of what these charts are and how to use them.
For a better understanding of what we do please read these
pages.
--- About Us What we found
that prompted us to develop our option program.
--- The OSCC overview of option trading.
--- The
OSCC Option Model.
--- Products
--- The Accuracy of the OSCC Option Model.
OR Go to: Forums visited
list and contact information.
Please read our
DISCLAIMER AND AGREEMENT
for use of this site.
[ Home ] [ Overview ] [ Model ] [ Ticker ] [ Charts ] [Chart Explanation] [ Risk Ranking ] [ ] [ Disclaimer ]
Last Updated on 10/31/2019
By Tom B
As used throughout this web site: 10/31/2019
OSCC is a trademark of Option Services for Commodities, Corporation.
CME is a registered trademark of the Chicago Mercantile Exchange, Inc.
CBT, CBOT and Project Aâ are Registered Trademarks of the Chicago Board of Trade.
(c) Copyright 1999-2005 OPTION
SERVICES for COMMODITIES, CORPORATION All Rights Reserved
This site relates to option trading of commodity options and futures with strategies that buy or sell
puts and calls either long or short for profit on treasury bonds and notes, Dow Jones Index, soybean products, Soybeans, wheat, oats, rough rice and T-Bond
options on the CBOT, Chicago Board of Trade through "floor
traders". We are also doing 6 currencies from the CME, the Chicago
Mercantile Exchange, the Japanese Yen, British
Pound, Swiss Franc, the Euro FX (ECU) and the Australian and Canadian dollars.
We also do 5 agriculture products, the S&P 500, NASDAQ 100 and EuroDollars
related to European and Economic Monetary Union (EMU) interest rates. Commodities are a high risk speculative hedging investment
and traders should use brokers for trading contracts who keep
their funds and money in accounts with high rates. This site provides free commentary, and technical analysis on commodity futures
and option premiums by OSCC from our futures charts and option charts for
use by traders.
This site no longer provides free quotes, although we do provide a free commodity ticker.